EVALUATION METRICS
EVALUATION METRICS
Here first we need to learn. how the evaluation metrics is going to help in model building process. To explain it i am gonna take a real life example when we are a child we use to go school.where our teacher teach us deliver the lecture and provide the class notes and take our test to check how much we understand the topic and to check the ability of the understanding of every student into the class so here we also do same thing we have a data set we will divide it into 2 part one is the train and other is the test part. train data set is consider as our teacher lecture and test part is consider as our exam's so that's why we make this Evaluation metrics to check the quality of our model .

Confusion matrix:-
A confusion matrix is the n*n matrix where n represent the number of classes in the variable in the titanic data set our dependent variable is only having two classes 1 = survived and 0 = not survived so in this cause the value of the n = 2 and the confusion matrix form is 2*2 matrix
now the row in this matrix is Actual value and the column in this matrix represent the prediction value
as you can see in this image

TP = the value which is actually positive and also predicted positive
FP = the value which is actually negative but predicted positive \
FN = the value which is actually negative but it is predicted positive
TN = the value which is actually negative and we also predict it negative
we use this matrix to evaluate our model
Accuracy:- this is the first and most popular evaluation matrix trick used for evaluation task
it is the ratio of correct predicted values over the total predicted values.
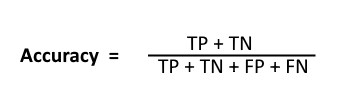
it is pretty state forward the correct predicted value divided by the the total predicted value
in reality accuracy as an evaluation on an unbalance data is not consider god and also it is called as it's limitation
Alternative To the Accuracy Metric
True positive rate:- Ratio of actual positive prediction over total actual positives
False Negative Rate :- Ratio of actual positive, predictive as negative; over total actual positive

True negative rate : Ratio of actual negative prediction over the total negative

False Positive Rate:- Ratio of actual negative predicted as positive; over total actual negative
we derived 4 matrix from the confusion matrix
in any given model TRP is always desireable higher the true positive rate better is the model also the lower the value of FNR better the model
Precision and recall
Precision :- it is defined as the ratio of all the positive predictions, hoe many actually positive
precision is used when we cannot afford to have false positive value or avoiding false positive is more important than encountering false negative
Recall : - it can be defined as out of total actual positive value, hoe many have been predicted as positive
recall is use when we can not afford false positive or avoiding false negative is priorities over encountering false positive
- high Precision, Low Recall
- high Recall, Low precision
- Choice depends upon the cause that which one is used
- Combined use F1 score
- F1 is maximum when precision = recall

so far we use the predictive classes of value 0,1 what if we have the probability of classes and not the classes them self and we need to use this probability value to check how my model perform
than we need to set a markdown that the value lies under 0.5 is consider as 0 and the value above than or equal to 0.5 is consider as 1 after that we can use all the metrices to predict the right value if our prediction value not satisfy our condition than we need to change it and set some threshold value in the place of changing the model we change the threshold value is called as thresholding
AUC-ROC:-
AUC = area under the curve
ROC = receiver operating Characteristic
ROC is originally used for distinguishing 'noise' from 'not noise' but in machine learning used for Evaluation Metric for binary classification
give trade of between true positive and false positive

Problem with AUC-ROC
- Consider only the order of probability because of this
- can't use to compare the two models
- to overcome this limitation we have an another metric names as log loss
Log Loss
it is the negative average of the log of corrected predicted probabilities for each instance.
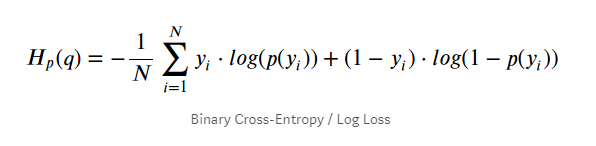
- p(yi) is the probability of 1
- 1-p(yi) is the probability of 0
Evaluation Metrics : Regression
- Mean Absolute Error
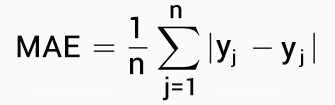
- Mean Squared Error :- in this value we square the value of error to avoid the negative value but it have a problem when we square the value it will change the unit of the error foe example if we have the error in meter id we square it will converted in meter square
- Root Mean Squared Error:- so to compensate the limitation of Mean square error we can take the root of the error and come back at our exact unit which is called as root mean square error

this is more often used in machine learning and the data science but it is not the best metric for the regression problem's RMSE basically use the difference of the error so it might be wrong in some place to overcome this limitation we use RMSLE

- Root Mean Squared log Error :- this bascially scale down the larger value
- R-squared:- in cause of classification problem of the accuracy is 0.8 we can compare with it random model the accuracy of which is 0.5 so random model here is treated as bench mark but when we talk about MSE and RMSE matrix we don't have a bench mark to compare we can use MSE value we generated last instied of using it alone we use it by dividing by MSE(baseline) model
as we can say as MSE decreases our model performance is increase which is quite contradictory to the general idea that higher value are better so that we simply squared relative square error with 1

R- squared either increases or does not change
- Adjusted r-squared
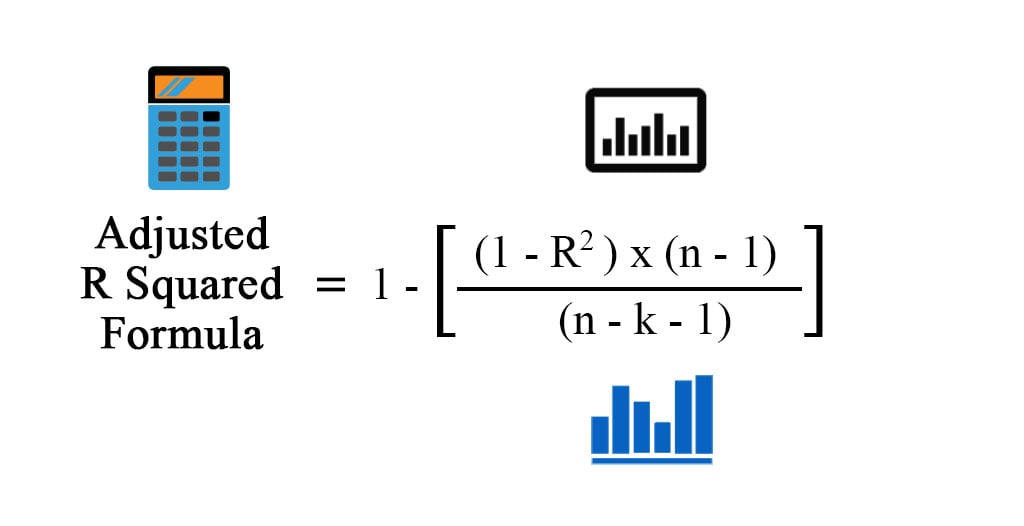
n = number of samples
k = number of features
now if we add the new feature the term in denomenator increases it means whole fraction increases

Comments
Post a Comment