ML(Predictive modeling)-1
Predictive modeling
1.make use of the post data and the other attributes
2.Predict the future using the data
To understand it let us take some examples to understand deeply. what it is..?
Example1:-
Recommending movies to a user based on the user attribute like location, age, gender and past movie watched etc.
is it's the example of predictive modeling
yes and it can be done in two way's
1. past movies:-
if a person watched lots of horror movies in past than it is sensible to suggest them horror movies
2 similarity :-
the people of particular age, gender ,sex, location etc. like a particular kind of movies so suggest them
same time of movies according to the previous movies watched.
in both this data we need past data to predict future task so it is a good example of predictive modeling
Example:2
Identifying the factor responsible for the sales reduction
in this we analysis the past data of sales but not predict the future data to it's not a example of predictive modeling but it is a good example of detective modeling.
Example :-3
Viewing the website today traffic using the goggle analytics.
Today web traffic nothing to do with past and future so it is not a example of predictive modeling.
Example:-4
Predicting stock price moments .
stock price is heavily influence by it past price so we need to predict it future price along with past price so it is an example of predictive modeling
Types of predictive modeling:
1. Supervised learning
2. un-supervised learning
supervised learning:-
1. regression :- if the target variable is continues in nature that the problem is called regression
i.e prediction of house price
in this the price of house is continuously go up and down it means the target variable is continues and it is a example of regression learning
2. classification:- if the target variable is discrete in nature than the problem is called classification problem
i.e cancer prediction
in this only the two options are present weather the patients have the cancer or not so the target variable is continues in nature so it is an example of classification problem
un-supervised learning:-
1. Document clustering whether the similar document need to keep together
2. whether need to segment our customer in a group
Both of this need clustering as an unsupervised task
Stages of predictive modeling :-
1. problem definition:-
the first step for succesfull model building is to defined a problem. it require multiple step
1. identifying the problem
2. defining it mathematically
i.e
Lets take a example of a bad problem statement
# Want to improve the profitability of credit card customer(we can do it by some steps )
1. want to increase the APR of the customer
2. want to deploy different APR to the different segment of the customer
all this are intermediate step depend on the default rate of the customer
so the good problem statement is :-
Want to predict the default rate of the customer
2. Hypothesis Generation:-
list down all possible variables, which might influence problem objective. this variable must be free
from bias and preference. since the quality of your model is highly dependent of quality of hypothesis
Example:- what are the factor those can impact customer will default or not ...?
1.income
2. job type
3. credit history
4.Education
this are some may be many more others
Note:- hypothesis generation is done before looking at the data it let you think all the factor which might affect the problem without being biased . it will also reduce the time wastage (by stop analysis all available data )
3. Data Extraction/Collection:-
Extract/collect data from different sources and combine those for exploration and model building
example:- for increase the profit of credit card customer
Data source are
1. Demographics
2. Transaction History
3.Payments History
4. Credit score
5. Competition pricing
4.Data Exploration and transformation:-
Data Exploration is gaining insights of the data
In order to understand the data and gain the insights their are certain step to follow
1. Reading the data:-
pandas can read lots of file format foe example:- CSV, Excel so Reading the data and converting it in pandas data frame is primary task in data exploration it is basically to reduce all the confusion of different file format .
2. Variable identification:-
variable identification is the process to identify which are independent and dependent variable at the same time we identify this variable as continuous and categorical variables.
Here the question arise why do we need to do this identification ...?
All supervised learning algorithm like logistic regression , linear regression etc. required a dependent variable and also algorithm handle categorical and continuous data differently their are different techniques for the processing for this variable
Take a look at Dependent and independent variable.
1. Dependent variable :- The variable we are trying to predict
2. independent variable:- The variable which help in predicting the dependent variable.
# How to identify the dependent and independent variable
can only be identified from the problem statement.
for example:- predicting the price of the house in this cause price of the house is dependent variable while all other factor which help us in this prediction are called independent variable
# Difference between categorical and continuous variable :-
1. Categorical Variable:- Discrete in nature just like gender of the person
2. Continuous Variable :- Can have infinite number of possible value just like age , price etc
#how to identify categorical and continuous variable With pandas
categorical variable :- start as object
continuous variable :- start as int or float
pandas has a method name as dtypes which tell weather the variable is object type or int or float :-

3. univariate analysis:-
In univariate analysis we focus at a single variable at a time summarize it and use thus summary to understand the data better.
Why do we need univariate analysis ..?
it will help us to detect the abnormalities in the data.
Their are different method of univariate analysis for different variable.
1. Continuous :- while working with it we look at
- central Tendency and dispersion :- mean , median and standard deviation
- Distribution of variable :- symmetric , Right skews, left skews
- Presence of missing value
- Presence of outlier's
1. Tabular Method :- best suited for the analysing mean, median , standard deviation and missing value in pandas to find out this we have a special function which are shown below


2. Graphical Method :- it is used to check the distribution of variable and to check the outliers
1. Histogram :- there is a special command present in our pandas module to plot histogram

2. Box plot :- To detect the outliers we mainly use box plot their is a special command present in
our pandas module for a box plot

2. Categorical variable:-
- count :- absolute frequency of each category in a categorical variable
- count% :- Proportion of different categories in a categorical variable expressed as%
- Tabular method :- frequency tables
#for count&count % :-

2. Graphical methods:- Bar plots
for count:-

for count%:-

4. Bi- variate analysis:-
we are going to talk about what is bi-variate analysis ..?
why do we need bi-variate analysis...?
how do we perform bi-variate Analysis..?
Lets start
What is bi- variate analysis ..?
- when two variable are studied together for their empirical relationship.
- When you want to see whether the two variable are associated with each other .
Why do we need bi-variate analysis?
- it will help in prediction
- let us consider the previous height weight example both are directly proportional to each other so if one variable is missing from any point so we can predict the other variable by making the straight line from the below to the line of proportionality
- It will also help in detect the abnormalities if a point is lying to much far from the line of proportionality it will may be indicate the abnormality
Types of Bi-Variate analysis:-
1. Continuous - continuous Variable :-
For example :- If the price of ticket increases for age ...?
In this we need to perform the bi-variate analysis and both the variable on which we are performing are continuous so if we want to perform the bi-variate analysis on c-c variable we need to find out the correlation
So the formula of the correlation is:-
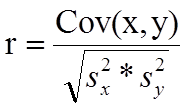
correlation measure the strength of linear relationship between two continuous variable along with the direction
Implementation of continuous- continuous correlation in Jupiter notebook using pandas

 # categorical-continuous Analysis :-

Is the mean of the age of moles different from the mean age of females...?
here age is the continuous variable where gender is categorical variable in this type of analysis we generally use bar plot to visualize
To evaluate the difference between males and females or two Group in general we use
2- Sample T-test
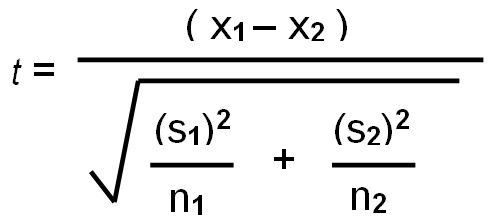
X1 = Mean age of males
X2 = mean age of Females
(S1)^2 = Variance of males
(S2)^2= Variance of females
n1,n2 = sample size
Implementation on Jupiter notebook
Plotting a bar plot using pandas module

performing 2-sample T-test on our data

Categorical-Categorical analysis:-
Does gender have any effect on the survival rate here..?
in this analysis both the gender and the survival rate are the categorical variable
Graph method :- this method give us the rough idea but we need to do lot more things

CHI- Square Test :-
Analysis Test:-

Implementation of Chi square t-test in pandas

5. Missing value treatment:-
1. Reasons for the missing value ..?
- Non-Response:- Example when you collect data on people's income and many choose not to answer
- Error in Data collection
- Error in reading Data
2. Types of the missing value ..?
- Missing completely at random( MCAR ) :- When the missing value have no relation to the variable in which the value exist's and and also no relation with the other variable of the data set
- Missing at Random(MAR):- it means the variable have no relation in which missing value exists but do have relation with other variable.
- Missing not at Random(MNAR):- it means missing value have a relation in which missing value's are present
3. Identifying missing value..?
- TO identify the missing value we use two function
- describe():- it is used for the continuous variable not used on the categorical variable Implementation of describe on Jupiter Notebook:-

- Isnull():- this function is used for both types of variable:- Implementation isnull function on Jupiter notebook:-


- 4. Different methods to deal with missing value..?
- Imputation:-
- continuous var :- Mean, Median and regression model
- categorical var :- Mode, Classification method
- Implementation on Jupiter notebook


2. Deletion :- We can use Row wise deletion and column Wise deletion
(i). Row wise deletion:- in this deletion we remove all the value of the row if one value is missing from the row
Implementation of some operations on Jupiter Note book


(ii). Column wise deletion :- it will delete all the value of the column if any rising value is present in the column
Implementation of column Wise deletion :-


6. Outlier Treatment:-
1. Reason for outlier's
- Data Entry Errors:- entering a salary of person is 1 billion instead of 1 lakh
- Measurement Errors:- Measuring particular data in km instead of meter
- Processing Errors
- change in the underlying population
2. Types of Outlier's
- Univariate Outliers:- the outliers in which we analysis single variable for outliers
- Bivariate Outliers:- The outliers in which we analysis two variable for outliers
3. Identifying Outlier's
1.Graphical methods:-
For univariate we use Box plot


an outliers is defined as any value which is
<Q1-1.5*|QR or Q3+1.5*|QR
where |QR = Q3-Q1
Q3 = Value at 3rd quartile
Q1= Value at 2nd quartile
4. Different method to deal with Outlier's
- Deleting Observation

- Transforming and Binning Value
- Implementing Outlier like missing value
- Treat them as separately

7. Variable Transformation
1. What is variable Transformation..?
Variable transformation is a process by which:-
1. we replace a variable with some function of that variable Example replacing a variable X
with its logarithm
2. we change the distribution or relationship of variable with other's
2.Why do we use Variable Transformation..?
1. Change the scale of variable For Example:- If 10 variable are measured in km and 1 in miles
2. Transforming non linear relationship into linear relationship
3.Create Symmetric distribution from skewed distribution
3.Common method for variable Transformation
1. Logarithm:- Taking log of the variable reduce right skewedness of the variable

2. Square Root:- Used for right skewed variable with positive values

3. Cube Root :- Used for the right skewed variable with positive and negative value.

4.Binning :- Used for converting continuous variable to categorical variable

5. Model Building :-
It is a process to create a mathematical model for estimating/predicting the future behaviour on past data
ex:- a retail bank wants to know the default Behaviour of its credit card customers they want to predict the probability of default per each customer with in next three month
Probability of default would lie between 0 and 1
Assume every customer had a 10% default rate
probability of default for each customer in next three months = 0.1
this model moves the probability towards one of the two extreme based on attribute from past information
A customer with volatile income is more likely (closer to 1 ) to default
A customer with healthy credit history for last 10 years has low chances of default (closer to 0)
6.Steps of model building:-
- Algorithm selection:- we select the algorithm dependent on the variable and or the problem present if a problem have a dependent variable than we need to perform supervised learning rather than unsupervised learning
- Training model:- it is a process of learn relationship/correlation between independent and dependent variable
- predicting/scoring :- it is a process to estimate/predict dependent variable of test data set by applying model rule

Comments
Post a Comment